General commentary, not personalised advice. Yields are US Treasury closes for 2 Oct 2026 and FRED closes on the dates shown; market prices are Yahoo Finance closes for 2 Oct 2026. History is our own calculation on Yahoo Finance, FRED and World Bank data. Horizon: 1 to 6 months.
The short version
- The bond market is under real stress and the stock index is not showing it. The 10-year yield closed at 5.28% and the 30-year at 5.63% on 2 October, levels last seen in 2002, while the S&P 500 sits about 1% below its record.
- This is a "pay me more to lend" move, not an inflation panic. Since February almost all of the rise has come from real yields and term premium. Inflation expectations have barely moved.
- Speed is the warning sign. The 10-year has risen about 2 standard deviations in a month. In 30 past cases like this since 1993, yields were still higher three months later 62% of the time. The first break is rarely the top.
- The reward came after the stall. In 12 fast yield rises since 1993, the S&P 500 was higher six months after the yield peak every time (median +10.6%), and long bonds, homebuilders and gold led the rebound.
- We would rather wait for the stall than guess the top. Clean long-bond auctions, softer Fed language and a smaller refunding are the signals history says to watch. Stocks now yield about the same as Treasuries, so the cushion if we are wrong is thin.
The bond market is moving faster than the stock market wants to admit. The 10-year yield has climbed from 3.97% on 27 February to 5.28% (US Treasury, 2 Oct), yet the S&P 500 sits barely 1% off its August record. That gap rarely stays this wide for long.
What is actually pushing yields up
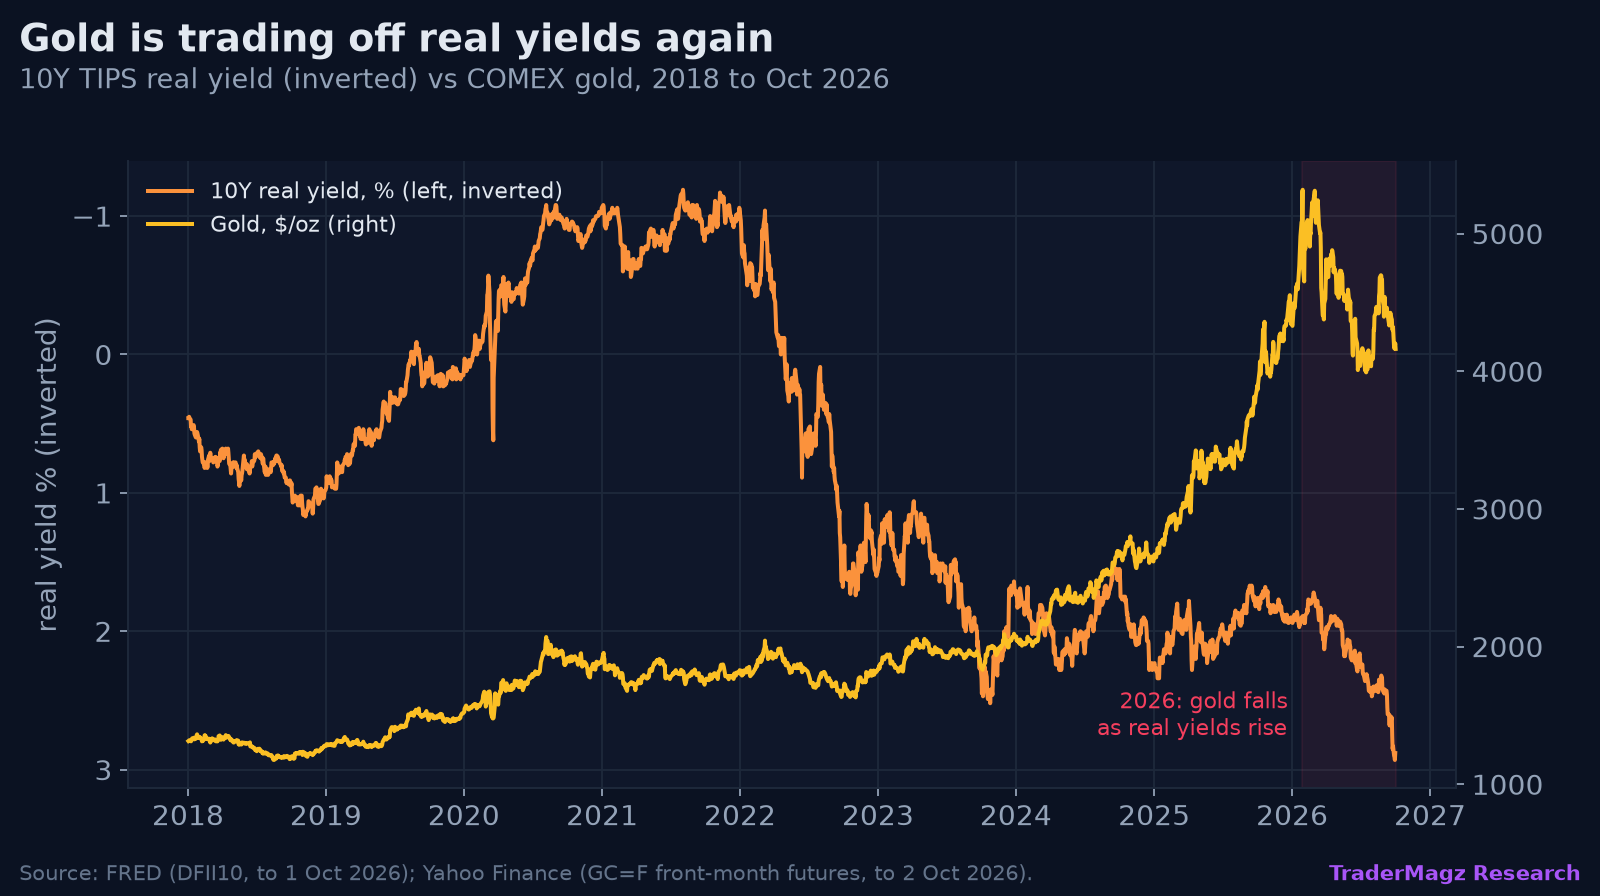
The key question is which part of the yield is rising. A Treasury yield splits into the real yield (what you earn after inflation, visible in inflation-protected TIPS bonds) and breakeven inflation (the inflation rate the market is pricing in). From the 27 February low to 1 October, the 10-year rose 127bp: the real yield rose 116bp and breakeven inflation only 11bp, to 2.36% (FRED). Investors are not panicking about inflation. They want a higher real return to lend to Washington. The 10-year TIPS yield closed at 2.93% on 30 September, the highest since November 2008 and well above the 2.52% peak of the October 2023 sell-off (FRED DFII10).
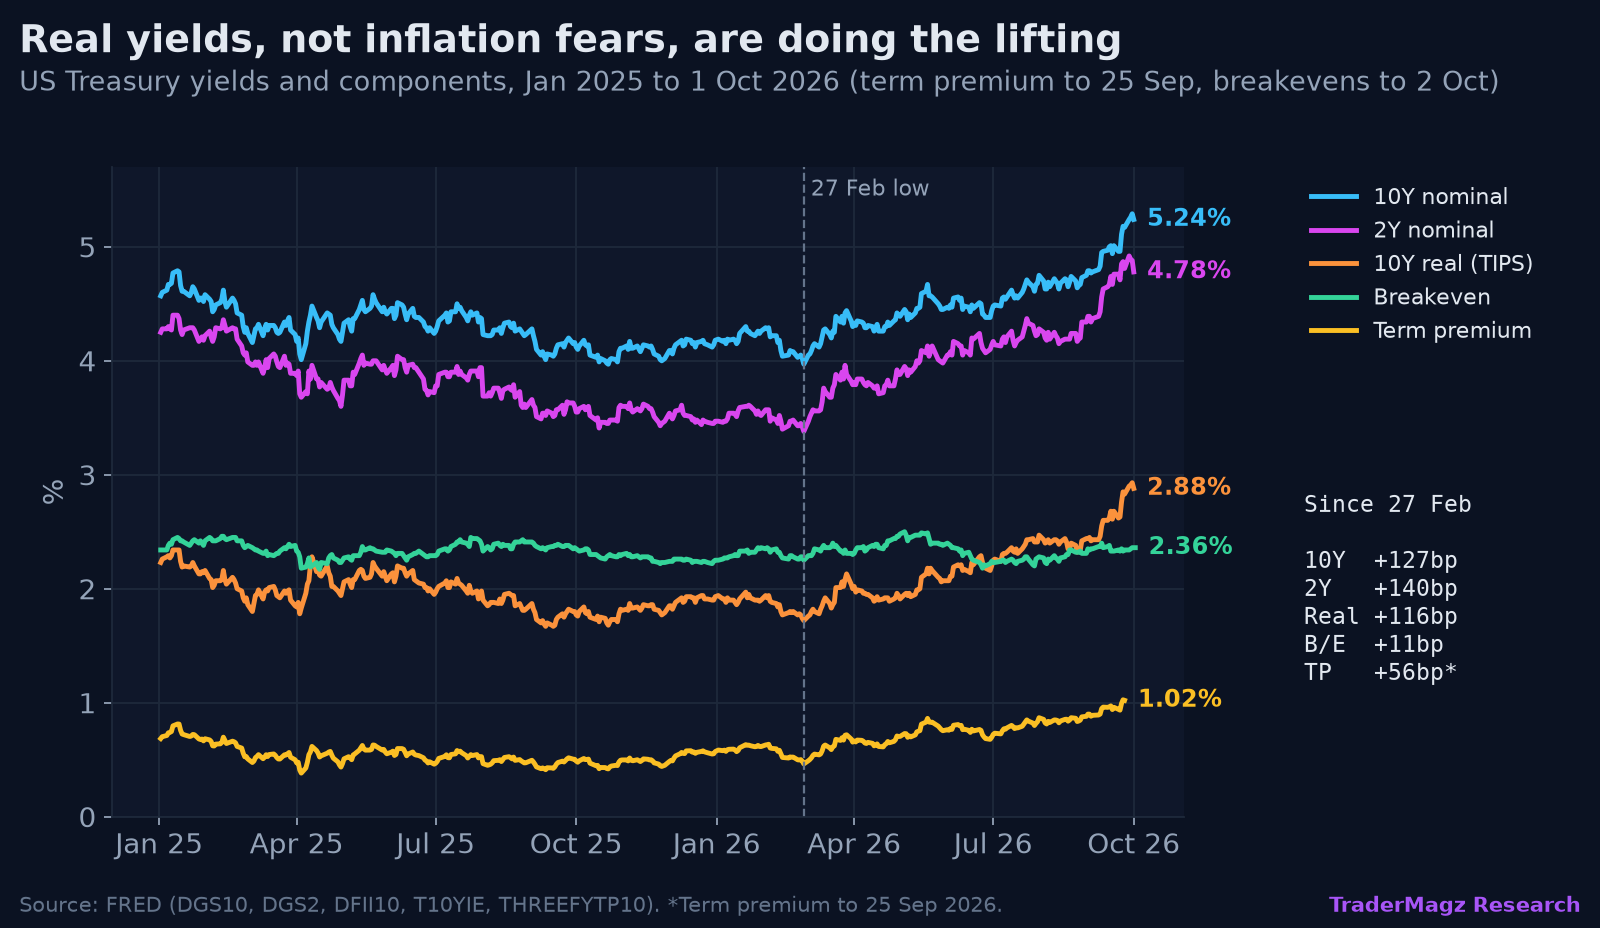
Two forces sit behind that. The first is the Fed: the FOMC raised rates by 25bp to 3.75% to 4.00% on 16 September, its first hike since 2023, and said inflation "remains elevated" (Federal Reserve, 16 Sep). The 2-year yield, which tracks Fed expectations most closely, is up 140bp since February, more than the 10-year.
The second force is term premium, the extra yield investors demand for locking money up for ten years instead of rolling short-term bills. This is where "bond vigilantes" live, buyers who push yields up until a government's borrowing looks fairly paid for. The Kim-Wright estimate of the 10-year term premium reached 1.02% on 25 September, its highest since April 2010 (FRED THREEFYTP10). Payden & Rygel argued on 10 September that "the term premium is doing the heavy lifting", citing a deficit near 6% of GDP and long-dated AI corporate debt competing with Treasuries for the same duration buyers (Payden, 10 Sep). When hyperscalers sell 30-year bonds to fund data centres, the pension funds and insurers who buy long Treasuries have another option, and the Treasury has to pay up.
Friday's jobs report showed that force at work. Payrolls rose just 29,000 in September, and July and August were revised down by a combined 60,000 (BLS, 2 Oct). Yet the 10-year closed 4bp higher and the 30-year 2bp higher on the day (US Treasury, 2 Oct). When bad growth news cannot rally the long end, investors are demanding to be paid for duration. History treats that differently from a growth rise. When yields rose on improving growth (2003, 2009, 2016, early 2021), stocks rose with them. When the Fed or term premium drove them (1994, 2018, 2022, late 2023), stocks fell or went nowhere. Today looks like the second group.
Speed matters more than level
Stocks can live with higher yields. What they struggle with is yields rising fast. Goldman Sachs found that stocks "usually generated positive returns alongside rising interest rates unless the pace" was more than two standard deviations, which it put at "roughly 50bp over a month or 30bp over two weeks" (Goldman Sachs, 15 Sep). That is the 2-sigma speed limit: a one-month move about twice the size of a typical month over the past three years. BlackRock agrees (BlackRock).
On 2 October the 10-year was up 48bp over 21 trading days, about 2.0 sigma, having first crossed the line on 24 September. In the 30 separate breaches since 1993, the median S&P 500 return over the next three and six months was 2.4%, against 3.3% and 5.8% for all periods. More important, the 10-year was higher three months later in 62% of cases, by a median 11bp. The first breach is a warning, not a turning point.
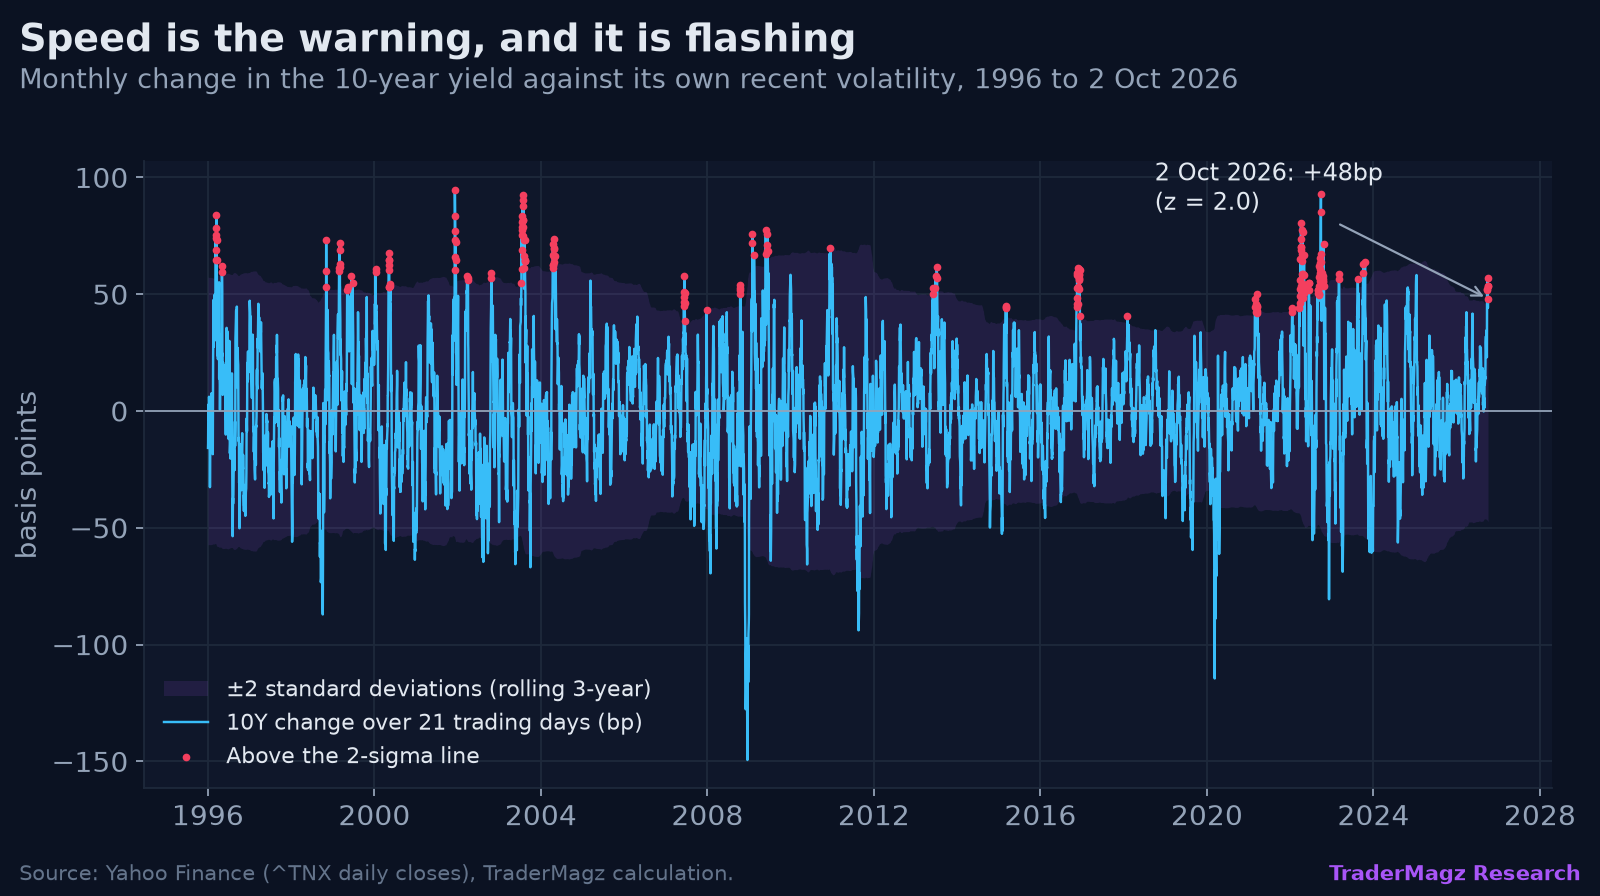
Level matters less. Goldman's David Kostin finds no clear link between yield levels and annual returns since 1940 (Goldman Sachs), though in our data the weekly link between stocks and yields turns negative once the 10-year is above 5%.
A calm index on top of a stressed bond market
Underneath the index, the repricing is well advanced. Since the February yield low, technology (XLK) is up 44.5% while homebuilders (ITB) are down 18.5%, utilities (XLU) 14.8% and long Treasuries (TLT) 12.0%, in total return. Since 28 August, the start of the latest leg, the equal-weight S&P 500 and small caps are both down 4.6% while the cap-weighted index is up 0.3%. A few very profitable megacaps are holding up the average.
Volatility shows the same split, and this is the liquidity warning we take most seriously. The MOVE index, the bond market's version of the VIX, closed at 107 on 2 October against a one-year average of 74, while the VIX closed at 15.3. BNY flagged the same divergence this month (BNY, Oct 2026). Treasuries are the collateral the financial system borrows against, so when they swing harder, dealers and leveraged funds cut risk everywhere. In 2022 and October 2023, equity volatility caught up with bond volatility, not the other way round.
What 12 past episodes say
We studied every fast rise in the 10-year since 1993, from low to high and then six months on. Peak dates are chosen with hindsight, so read the "after" numbers as what happened once a top was in, not as a timing tool.
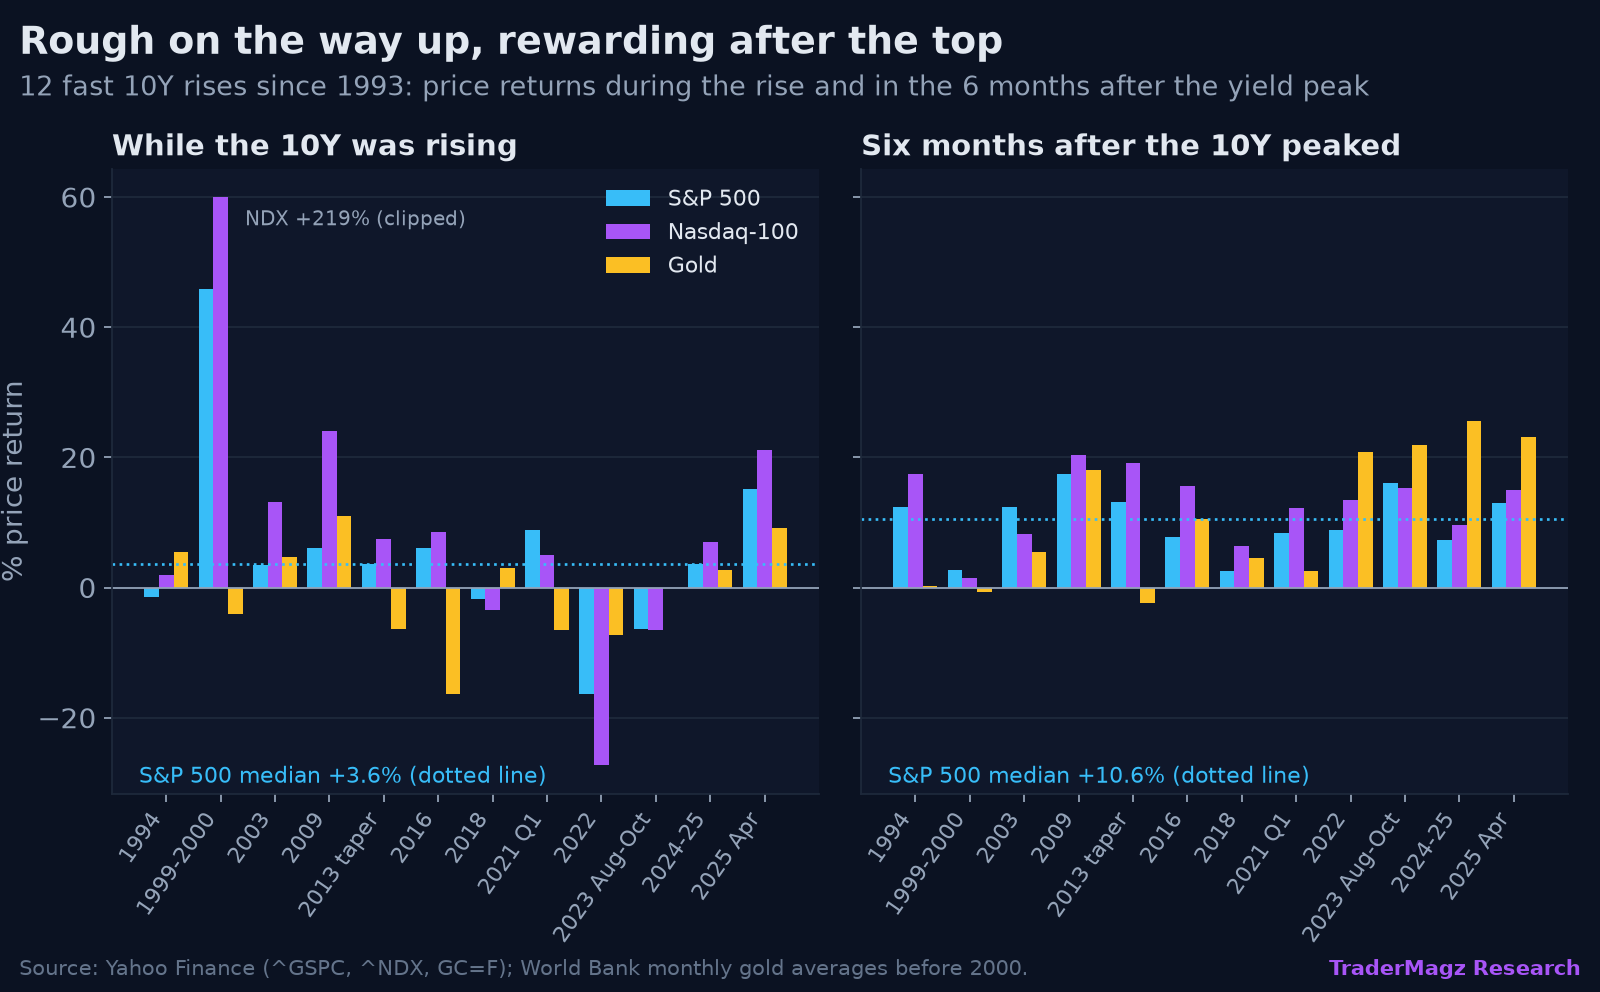
Stocks usually still rose while yields climbed (median +3.6%), but not in the Fed and term-premium episodes of 1994, 2018, 2022 and 2023, which saw drawdowns of 9% to 25%. Once the 10-year peaked, the S&P 500 was higher six months later in all 12 episodes (median +10.6%), and the 10-year was lower every time, by a median 49bp.
The rotation underneath is consistent: rate-sensitive assets pay during the climb and lead after it. Homebuilders lagged the S&P 500 in 8 of 9 rises, then beat it in all four closest analogs (2013, 2018, 2022, 2023), by a median 20 points six months after the peak. Long Treasuries lagged in every rise and returned a median 9.1% in the six months after. Energy did the reverse, and banks were not the hedge they are often sold as. Unprofitable growth (ARKK) was the worst place to be in tightening episodes, falling 62% in 2022, while quality companies with real earnings held up throughout. Four analogs prove nothing on their own, but the direction has been consistent.
If the returns come after the peak, what ended each climb? Rarely the data alone. Tops came when the people who set the price or supply of money blinked, or the market forced them to. In 1994 the 10-year peaked a week before the Fed's largest hike of the cycle (Federal Reserve, 15 Nov 1994), so bonds priced the end of tightening before it arrived. In 2013 and 2018 the top came just ahead of the Fed softening its language, first by delaying the taper (Federal Reserve, 18 Sep 2013), then with Powell's "just below" neutral (Federal Reserve, 28 Nov 2018). In 2023 yields peaked on 19 October, and the decline began in earnest on 1 November, when the Treasury raised long-bond auction sizes by less than expected (Reuters, 1 Nov 2023).
Auctions deserve special attention. Treasury auctions do not literally fail, but a badly "tailed" one, clearing well above where the bond traded just before, is the bond market's version of a capitulation day. Yields peaked on 21 May 2025 straight after a weak 20-year auction that followed Moody's downgrade of the US (CNBC, 21 May 2025): a final flush of selling, then exhaustion. MOVE was usually high at these tops (154 in 2022, 135 in 2023), though 2018 topped without a spike. In 2018, 2022 and 2023, the lows in stocks, gold and Bitcoin all landed within about seven weeks of the yield top.
None of those relief signals is visible yet. The Fed hiked three weeks ago, and the next refunding policy statement, the event that turned the 2023 top, is scheduled for 4 November (US Treasury).
Stocks are paid very little for the risk
Higher yields also give investors a safe alternative to stocks, and that effect is now unusually strong. FactSet put the S&P 500's forward P/E at 19.0 on 30 September, down from 20.4 in June, as forward earnings estimates rose 9.3% and the index only 2.0% (FactSet Earnings Insight, 2 Oct). Flip that P/E into an earnings yield and you get about 5.26%, almost exactly the 10-year's 5.29% close that day. Stock buyers earn about the same yield on forecast profits as Treasury buyers earn with no equity risk.
The equity risk premium, the extra annual return the market's price implies stocks will earn over Treasuries, says the same thing. Aswath Damodaran's estimate was 3.70% on 1 October, the lowest monthly reading in his series since September 2008 and below his 1960 to 2025 average of 4.25% (Damodaran, NYU Stern).
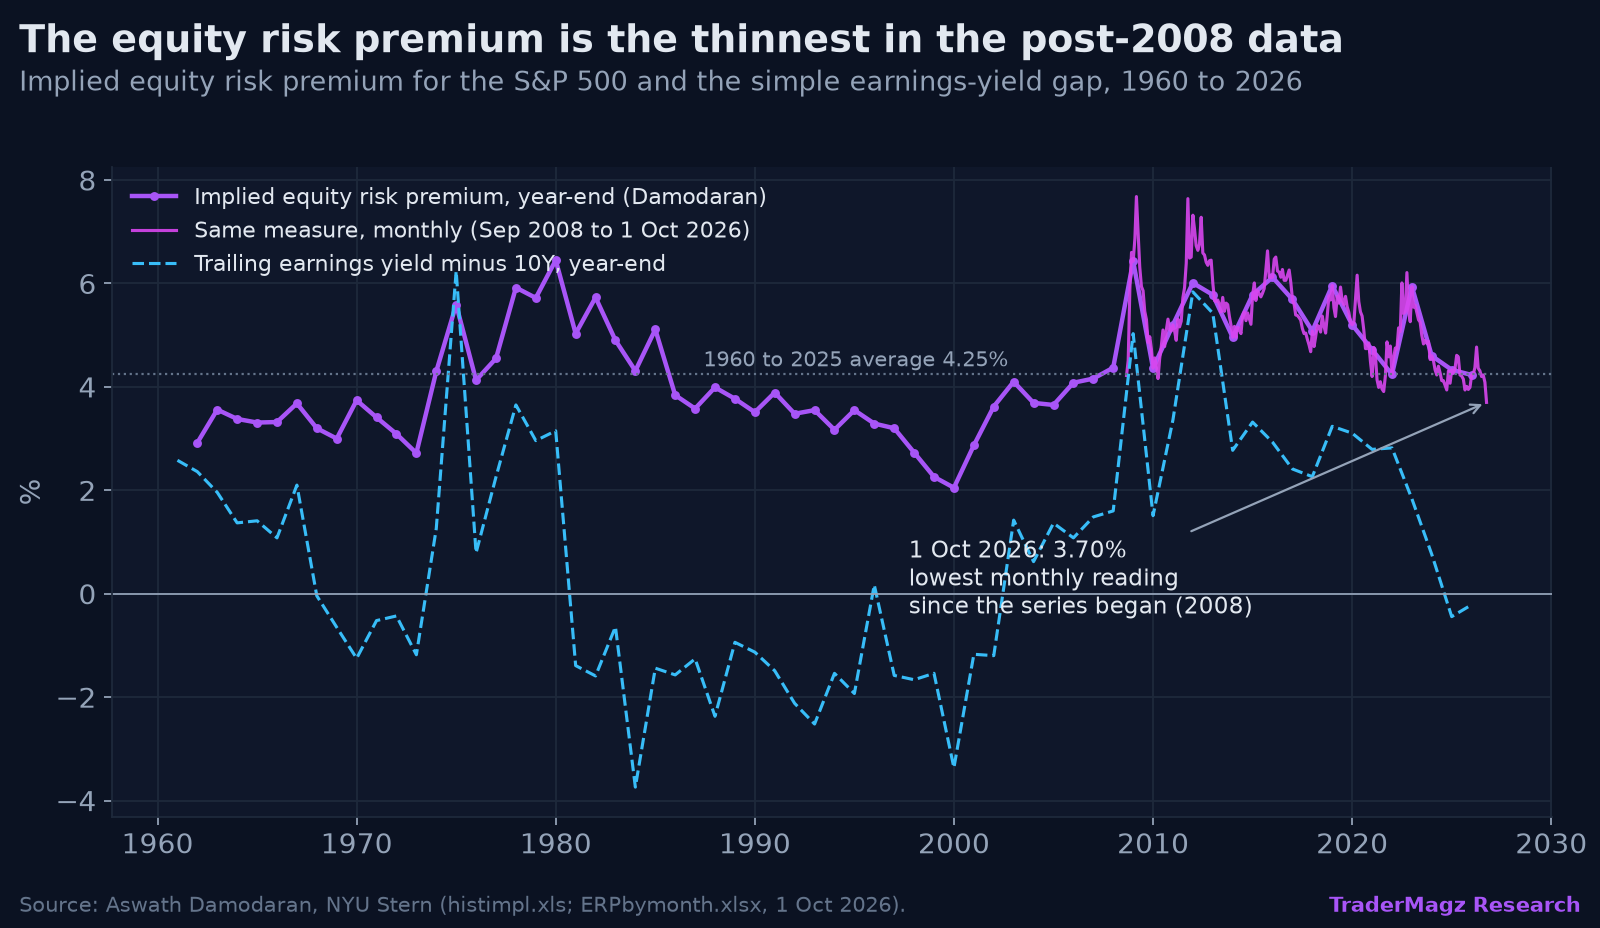
This is not a timing signal: the premium stayed thin through most of the late 1990s while stocks kept rising. What it changes is the cushion. The index now depends on earnings continuing to beat and has less room to absorb another leg up in yields.
Gold, silver and Bitcoin
Gold is trading off real yields again. Gold futures closed at $4,162 on 2 October, 21.7% below the 29 January record, and silver at $59.98, 48% below its 26 January record. Precious metals have done worst while real yields spike and best once they peak: gold was higher six months after the yield peak in 10 of 12 episodes (median +8.0%), including +21% after 2022 and +22% after 2023. Copper, up 8.1% since February, is the one metal still telling a growth story.
Bitcoin, about $84,500, is the most liquidity-sensitive asset here: its three-month median after 2-sigma spikes was -3.7%, yet it rose 122% in the six months after the October 2023 peak. Seven episodes give direction, not precision.
Four paths, what to watch, and what history suggests in each
These are judgement weights, not model output, anchored on the base rate that yields were higher three months after a 2-sigma spike about 6 times in 10. Flat breakevens and a Fed with no pause signal keep the inflation-scare and early-peak odds lower.
For the third path, why yields fall matters as much as whether they fall. If the Fed relents or supply eases, history is kind to stocks. If a recession is starting, stocks can fall anyway: the S&P 500 was only 2.7% higher six months after the January 2000 yield peak, and a bear market followed. September's weak payrolls keep that caveat close.
What history suggests for traders and for investors
This describes what has happened before, not instructions; every reader's risk and horizon differs.
For swing traders working on one to eight weeks, past episodes say respect the trend in yields until it visibly stalls. Buying homebuilders, REITs, utilities or long bonds while the 10-year is still making new highs has historically meant catching a falling knife. Better entries came after a visible stall: the 21-day change back toward one standard deviation, no new high after a hawkish catalyst, or two clean long-bond auctions in a row. With MOVE near 107, ranges are wide, and volatility clusters around the 10-year auction and FOMC minutes (7 Oct), the 30-year auction (8 Oct), CPI (14 Oct), the FOMC decision (28 Oct), the refunding (4 Nov) and payrolls (6 Nov). Gold, silver, unprofitable tech and long bonds share one driver, real yields, so holding all four is closer to one big bet than four.
For longer-term investors, history argues for patience and staged decisions rather than one call on the top. Quality companies with real earnings held up through the climb and led afterwards. Bills pay about 4.2%, far more than the near zero of 2013, so waiting is not dead money. Duration, gold, homebuilders and REITs paid well once real yields topped, but nobody rings a bell, so adding in steps as the signposts turn has fit the data better than going all in.
The bear and the bull, steelmanned
The bear case is that this is the dangerous kind of rise, driven by the Fed and term premium rather than an inflation spike that could cool quickly. The deficit is near 6% of GDP, AI borrowers are adding long-dated supply, and the long end just shrugged off a 29,000 payroll print. Real yields and the equity risk premium are at their most stretched since 2008, and bond volatility far exceeds stock volatility, a gap that closed with stocks falling in 2022 and 2023. If this week's auctions tail badly, a 1994-style overshoot is plausible.
The bull case is that earnings are doing the work. Forward estimates rose 9.3% last quarter while prices rose 2%, so the market has de-rated, not inflated. Inflation expectations are stable and copper is rising. Above all, stocks were higher six months after every yield peak we studied, and much of the damage in rate-sensitive assets is already done.
What would change our mind: breakevens above 2.50% would make this an inflation problem (the 2022 template). A falling dollar alongside rising yields, as in April 2025, would signal investors selling US assets outright. High-yield spreads have widened from 2.63% on 31 August to 3.10% on 2 October (FRED), and a sharp further move would point to a credit accident. If real yields stall while earnings keep beating, we would turn constructive sooner.
Bottom line
The 10-year has broken the speed limit that has historically troubled stocks, and the move is coming from real yields and term premium, the kind that hurt in 1994, 2018, 2022 and 2023. History says the climb is the hard part, the first breach is rarely the top, and the reward comes once yields stall: stocks were higher six months after all 12 peaks. The edge is in recognising the stall when auctions, the Fed or the Treasury hand it to us, not in guessing it early. The main risk is a 1994-style overshoot while stocks offer almost no cushion over bonds. This is research, not personal advice.
Sources and method: yields from US Treasury par curve closes and FRED (DGS2, DGS10, DGS30, DFII10, T10YIE, THREEFYTP10, BAMLH0A0HYM2) as dated. Payrolls from the BLS Employment Situation (2 Oct 2026). Event dates from the Federal Reserve, BLS and US Treasury calendars. Episode peaks come from daily ^TNX closes in windows we chose, so post-peak returns carry hindsight. Index returns are price only; sector figures are dividend-adjusted ETF returns relative to SPY. Gold before August 2000 uses World Bank monthly averages. Bitcoin rests on 7 episodes. The equity risk premium is Damodaran's trailing-12-month implied measure.