There's a popular story going around. Treasury Secretary Scott Bessent and Fed Chair Kevin Warsh are supposedly lining up a flood of liquidity, net liquidity is about to jump past $7 trillion, and the inflation that follows will quietly shrink the debt. It's a good story, so I rebuilt the numbers myself. The short answer is: not yet.
Where we actually are
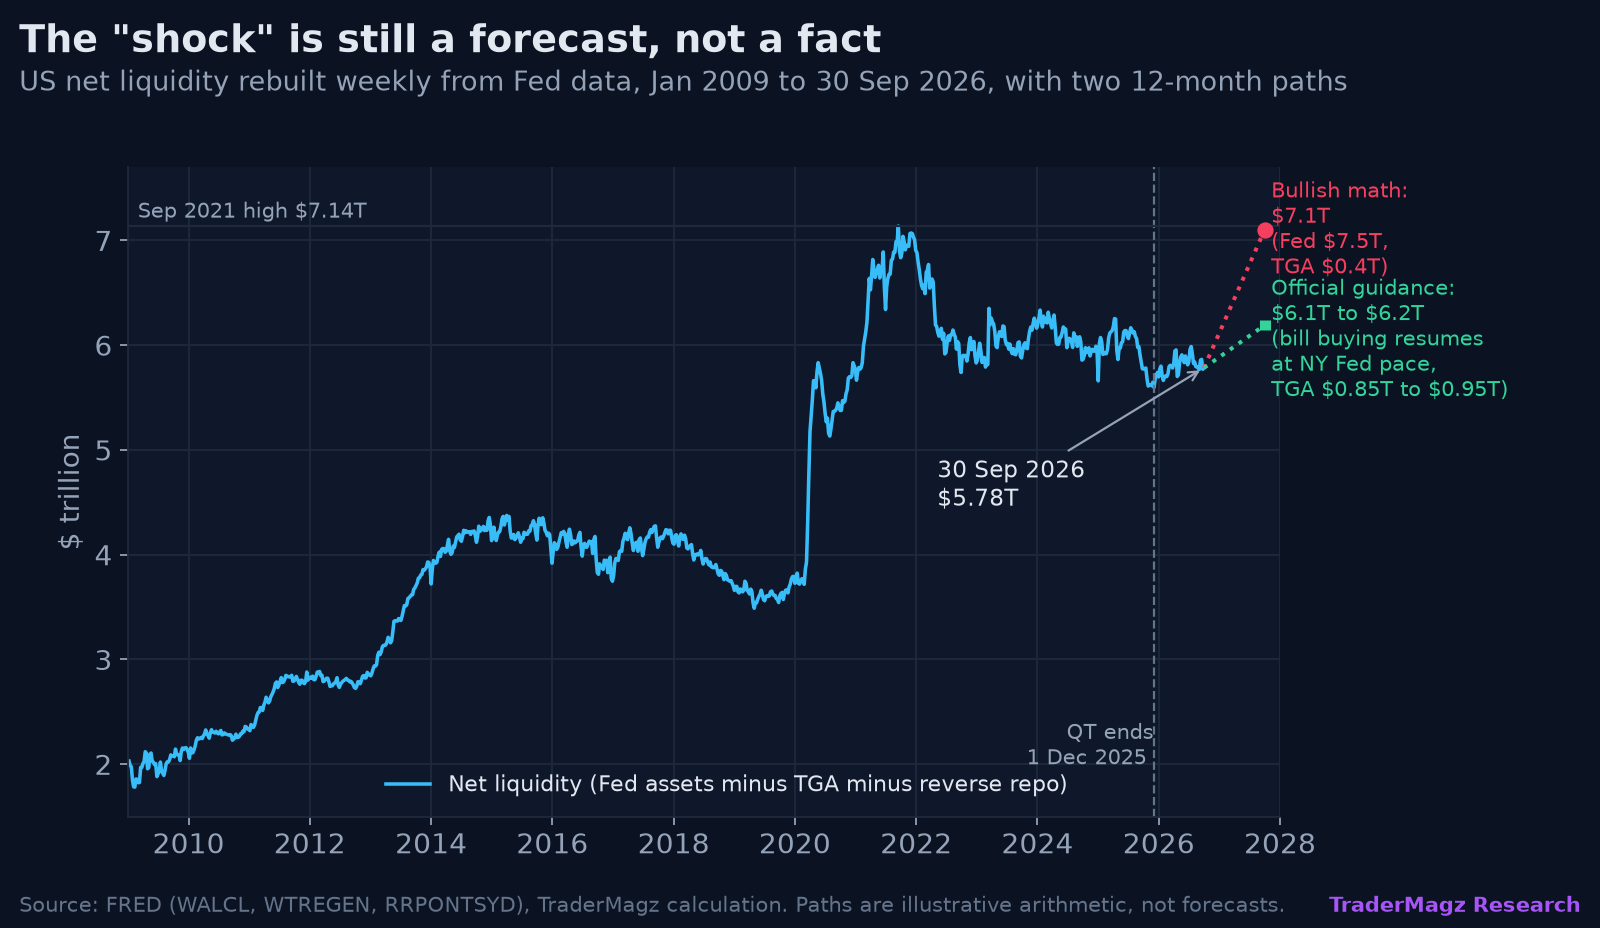
Net liquidity is the Fed's balance sheet, minus the Treasury's cash account at the Fed (the TGA), minus the reverse repo facility. Cash parked in those two isn't working in markets. On 30 September that came to $5.78 trillion, up just $8 billion on a year ago. It has moved sideways in a band between $5.6 trillion and $6.0 trillion all year, well below the 2021 peak of $7.14 trillion.
There has been a turn. Since the Fed stopped shrinking its balance sheet in December, net liquidity is up $187 billion from its low. That's a real change of direction. It isn't a shock.
Why $7 trillion is a stretch
To get there, the Fed would need to buy about $750 billion of bills in a year. That's more than double the New York Fed's own projected pace, and it has paused those purchases since mid-August. Warsh has said a growing Fed balance sheet did "quite a bit of harm", so he isn't the man to speed it up. Treasury's own guidance has its cash pile peaking around $1.05 trillion in late October and still at $850 billion at year end, not the $400 billion the bullish math needs. If you plug in official guidance, I get roughly $6.1 trillion to $6.2 trillion a year from now. The direction is up, but the size is about a third of the hype.
What Bessent and Warsh are really doing
Bessent's problem is the cost of long-term borrowing, not a shortage of money. Treasury has doubled its buybacks of 10 to 30-year bonds and is replacing them with short-term bills. That changes the mix of debt, not the amount of cash in the system. Meanwhile the Fed hiked rates in September to 3.75% to 4.00%.
And here's the part that kills the stealth tax idea. Inflating away debt only works when savers earn less than inflation. Today the 10-year real yield is 2.91%, the highest since 2008, with the 10-year at 5.27% and the 30-year at 5.64%. Lenders are getting paid more, not less, as I covered in Yields Past the Speed Limit. For now, the bond market is doing the taxing.
Liquidity still matters for prices
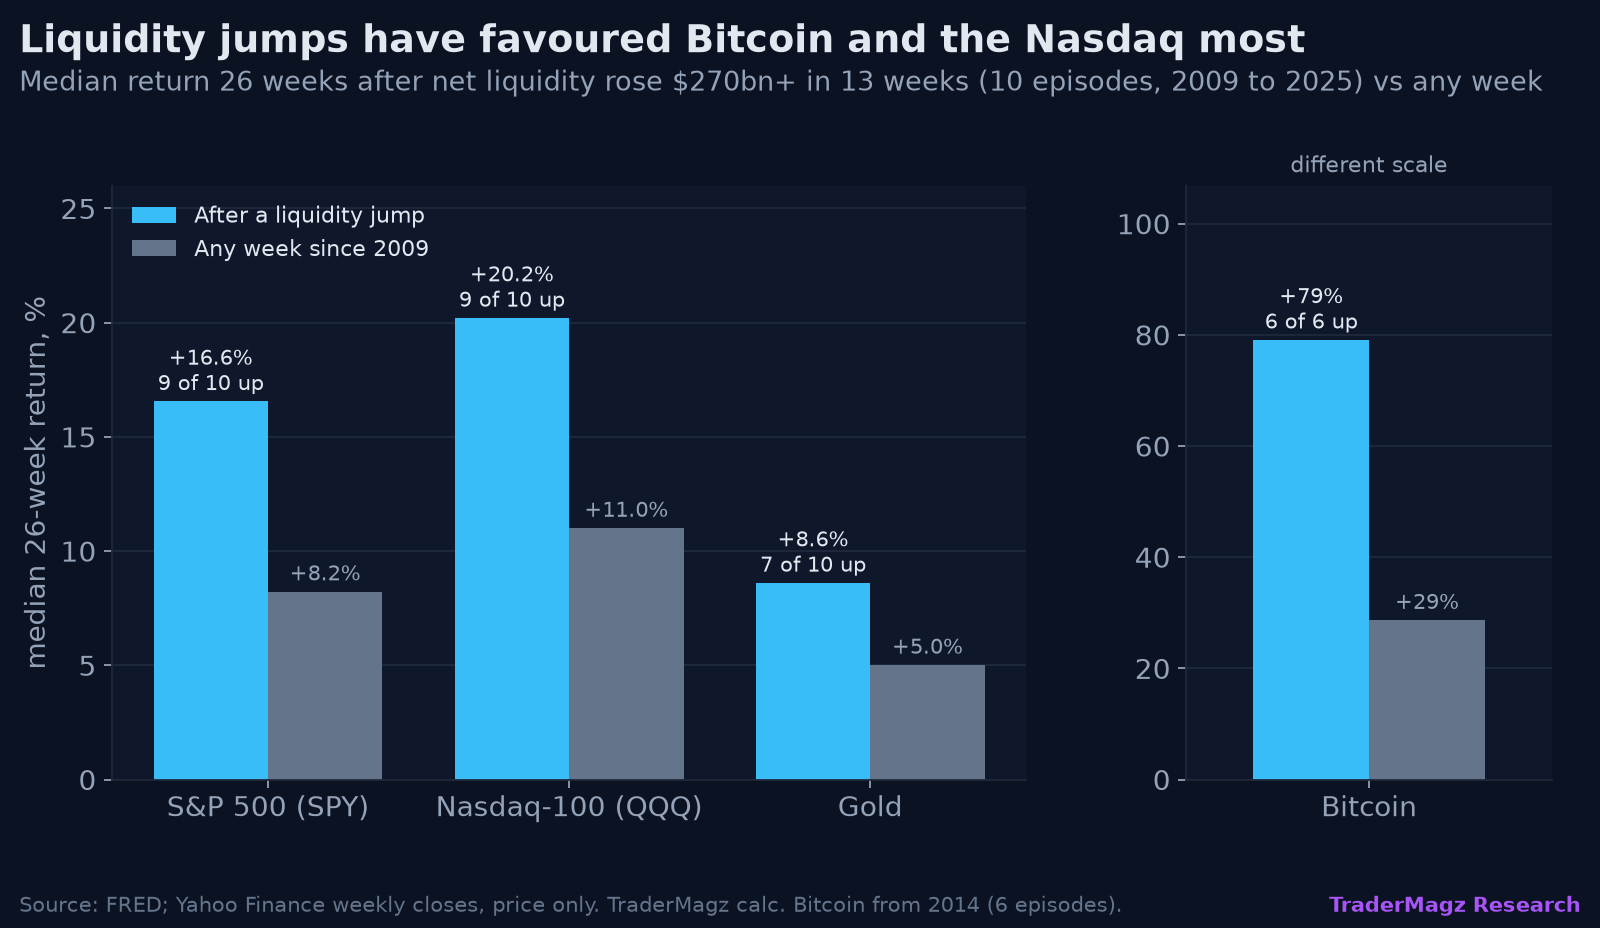
I looked at the 10 biggest liquidity jumps since 2009. Six months later, the S&P 500 was up 9 times out of 10, with a median gain of 16.6%, about double a normal six-month stretch. The Nasdaq-100 was up 9 out of 10, median 20.2%. Bitcoin was up all 6 times it existed, median 79%. The catch is that several of those were rescues (2009, 2020, 2023), and the one big miss, 2011, shows liquidity doesn't beat a real shock. The inflation link is weaker still. Through the 2010s liquidity ballooned and core inflation sat near 2%.
What would change my mind
Three things together. The New York Fed restarts bill buying at $30 billion a month or more. The 4 November Treasury refunding cuts its cash target well below $850 billion. And net liquidity breaks above $6.3 trillion while real yields fall. If that happens, the shock is real and I'd lean in.
How to use it
For traders, the setup that has worked best is the Treasury spending down its cash after the late-October peak while the Fed is buying again. That favours Bitcoin and the Nasdaq first. A cash rebuild with Fed buying on hold is a headwind, so keep size smaller while bond volatility is high.
For investors, don't build a portfolio around a liquidity forecast. Real yields have done more of the work this year, and they still argue for patience on rate-sensitive assets until long yields stall.
Bottom line
The direction is right. The Fed has stopped shrinking, and Treasury is sitting on a big pile of cash. But the jump people are pointing to hasn't happened, and official guidance points to a much smaller rise. Until that changes, the market's bigger problem is the price of money, not the quantity.
General commentary, not personal financial advice.
Data: Federal Reserve via FRED to 30 Sep 2026; yields FRED closes 6 Oct 2026; market returns Yahoo Finance weekly closes, price only. History is my own calculation.